Every media plan is the same four-step chain
A Meta media plan looks complicated in a deck and simple in arithmetic. Between a budget and the revenue it produces sit exactly four numbers, each handing its output to the next. CPM prices your impressions. CTR decides how many impressions become site visits. Conversion rate decides how many visits become orders. AOV turns orders into dollars.
Read left to right, a budget becomes a ROAS projection. Read right to left, a revenue goal becomes a required budget.
The projection will be wrong, and that is fine. Treat any output as the center of a band roughly 30% wide in either direction, because auctions reprice, winners fatigue, and traffic mix drags conversion rates around. What the exercise reliably exposes is the assumption doing the heavy lifting. A model that only works at a 2.5% CTR is not a spend plan. It is a creative brief with a budget attached.
One measurement rule governs everything downstream: the chain runs on link CTR, the clicks that leave Meta for your site. CTR (all) also counts reactions, expands, and profile taps. It commonly reads two to three times higher on the same ad, and every number built on it inherits the inflation.
The forward pass: what a budget should buy
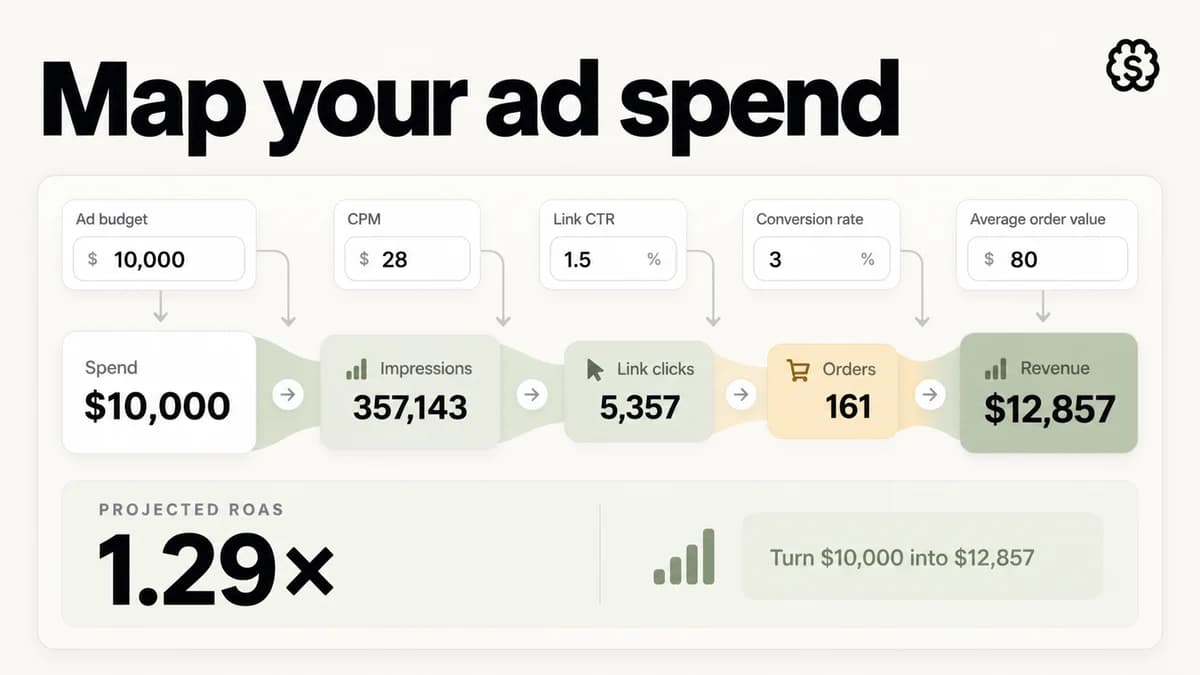
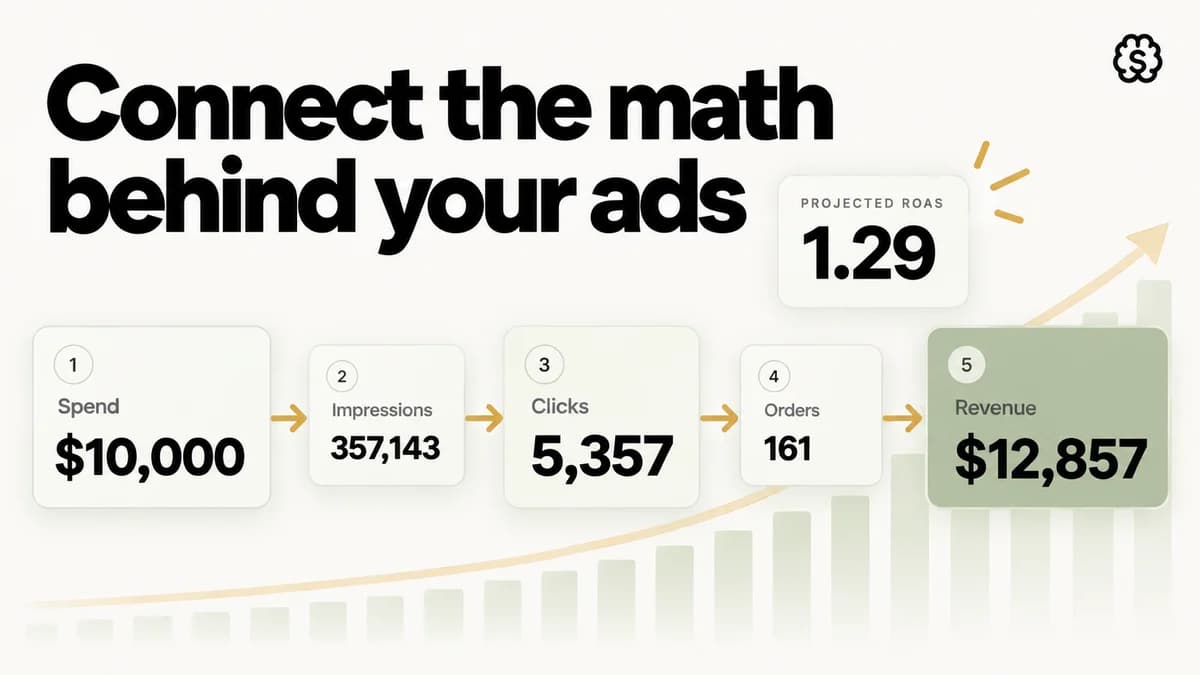
Run the chain left to right and a spend decision becomes a testable claim. Take a $10,000 month at planning-grade inputs: $28 CPM, 1.5% link CTR, 3% click-to-order conversion, $80 AOV. Feed those in and the month resolves to roughly 357,000 impressions and 5,357 clicks, an effective $1.87 CPC. The clicks in turn yield about 161 orders, a $62 CPA, and $12,857 in revenue. That is a 1.29 ROAS.
Is that any good? The chain cannot say; margin decides. A typical $80-AOV DTC brand breaks even near a 1.76 ROAS, so this plan, respectable inputs and all, funds a loss on every order. Rerun it with a 2% CTR and a 3.5% conversion rate: the identical $10,000 comes back at a 2.0 ROAS. The media buy never changed. The ad and the landing page did all the moving.
That is the whole job of the forward pass: it turns a spend decision into an orders-and-ROAS claim you can argue with before launch. The Ad Spend Calculator runs it live from your own inputs and flags the common measurement traps, like retargeting conversion rates smuggled into prospecting math.
The reverse pass: what a goal really costs
Flip the chain and it answers the other planning question: what does a revenue goal cost? Instead of multiplying a budget forward, divide the goal backward. Revenue over AOV gives orders. Orders over conversion rate gives clicks. Clicks times CPC gives the budget, and goal over budget gives the ROAS the plan silently assumes. Concretely: a brand wants ads to drive $50,000 next month at an $80 AOV, a 3% conversion rate, and the $1.87 CPC from the forward example.
625 orders ÷ 3% conversion = 20,833 clicks
20,833 clicks × $1.87 CPC = $38,958 budget → 1.28 implied ROAS
Two derived numbers matter more than the headline budget. First, spend against goal: paying $38,958 to earn $50,000 means media eats roughly 78 cents of every dollar it brings in. Second, the implied economics: $62.33 per order at a 1.28 implied ROAS. Put 1.28 next to the 1.76 break-even and the plan's real shape appears. It reaches its goal, and every order that gets it there lands slightly underwater.
The Ad Budget Calculator surfaces both implied figures before you commit anything. Notice, too, that the forward and reverse examples share the $1.87 CPC. They are the same arithmetic pointed in opposite directions, and a plan you trust should give consistent answers from either end.
Which levers you rent and which you own
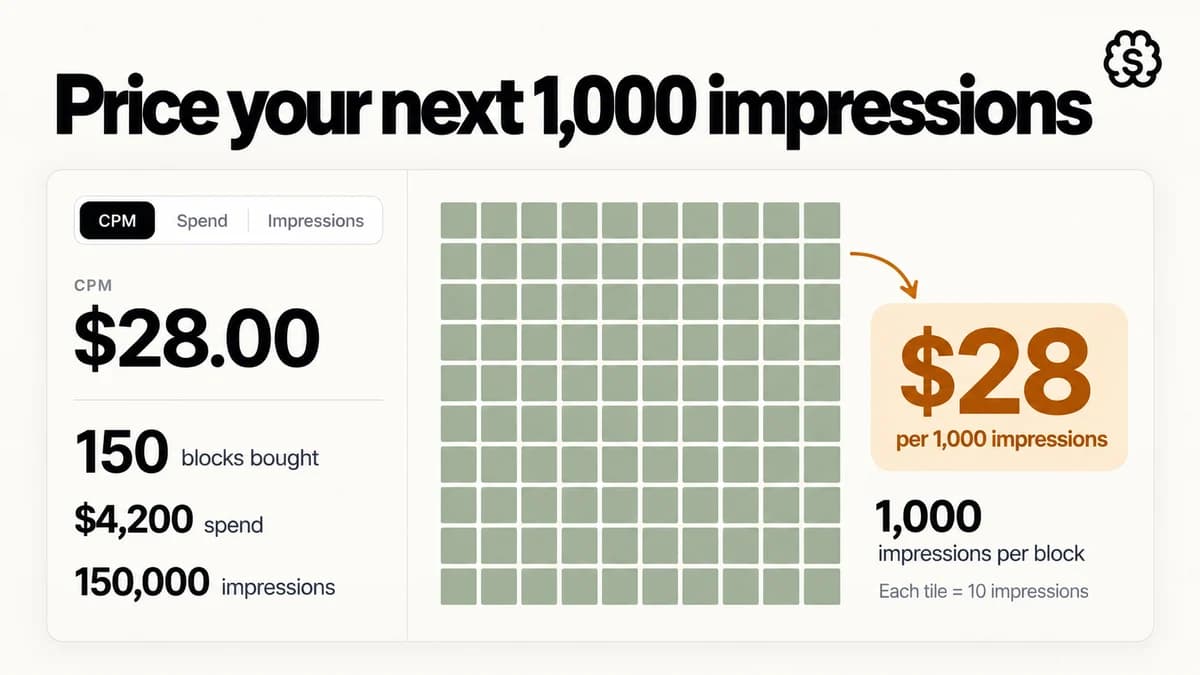
Sort the chain's inputs by who controls them and the strategy writes itself. CPM is the rented one. The auction prices it off audience size, placement, competition, and season, and no amount of skill exempts you from a Q4 surge. Bargain hunting for cheap CPMs mostly backfires, since impressions nobody else wants tend to be impressions that do not click. The CPM Calculator tells you what delivery costs. It has no opinion on whether the delivery is any good.
CTR and conversion rate are the owned pair. CTR answers to your hooks and angles. Push it from 1.5% to 2% and identical spend buys 33% more clicks. At a $28 CPM, doubling link CTR from 0.9% to 1.8% cuts CPC from $3.11 to $1.56. Conversion rate answers to your page and offer. From a 3.01% baseline, half a point more adds about 27 orders and $2,143 per period. The traffic stays the same; the take changes.
That compounding settles the classic account-review argument. Reshuffling budget between ad sets rearranges the same clicks; new creative and page tests mint new ones. A better hook does what no bid setting can, at zero extra media cost.
Check the plan against break-even before you believe it
Both worked examples penciled, and both lost money. The difference between penciling and profiting lives outside the chain entirely, in contribution margin: what each order keeps after product cost, shipping, and fees are paid.
For the brand in these examples, an $80 order keeps $45.38, and dividing the two puts break-even at 1.76. Every projected or implied ROAS gets measured against that line. Above it, the plan earns money at its stated inputs. Below it, where 1.29 and 1.28 both sit, more budget only digs faster, because scaling a per-order loss produces a bigger loss, never a rescue.
Build the plan with air between it and the line. Refunds come in, discount codes stack, and CPCs drift upward mid-flight, each one quietly shaving the margin you modeled. A target around 20% above break-even gives the quarter room to absorb a bad week. Your own line takes about two minutes to compute in the Break-Even ROAS Calculator, and it is the cheapest insurance in this whole guide.
Planning ranges when you have no history
The best benchmark is not a benchmark. Pull your own last 30 days, split by campaign type, and you get numbers with your audience, creative, and auction already baked in. With no history at all, lean on directional 2026 envelopes for US DTC prospecting on Meta, and hold them loosely: they bound plans, they do not predict results.
Expect CPM between $20 and $45, with narrow audiences and Q4 at the expensive end. Expect link CTR between 0.9% and 1.8%, with strong creative clearing 2%; pencil cold traffic at 1.2% to 1.5%, and treat better weeks as found money. Expect click-to-order conversion of 2% to 4% on a healthy product page at typical AOVs. As a cross-check, the medians imply a CPC inside the $1 to $3 per-link-click band most DTC accounts live in.
Then guard how the ranges combine. A plan that requires the optimistic edge of CPM, CTR, and conversion all at once is a lottery ticket wearing a spreadsheet. Anchor every input at its median, and let the good end of each range serve as error margin. Finally, let data retire the assumptions: read nothing from a cell under roughly 50 orders, and trust 100 more.
Where StefanBrain fits
Follow the chain to its conclusion and the media plan's fate is set by two numbers the media plan cannot move: CTR and conversion rate. Those are creative and landing page problems, and that is the production loop StefanBrain runs. It generates Meta-ready static ad concepts in minutes, each built around a testable hook, angle, offer, or visual pattern. A losing projection gets a new creative round, not a new spreadsheet.
When the set is approved, bulk Meta publishing pushes the whole batch to your ad account in one pass. Performance then flows back into the same system that made the creative. Plan the math with the calculators. Then point the production loop at the two levers you own.