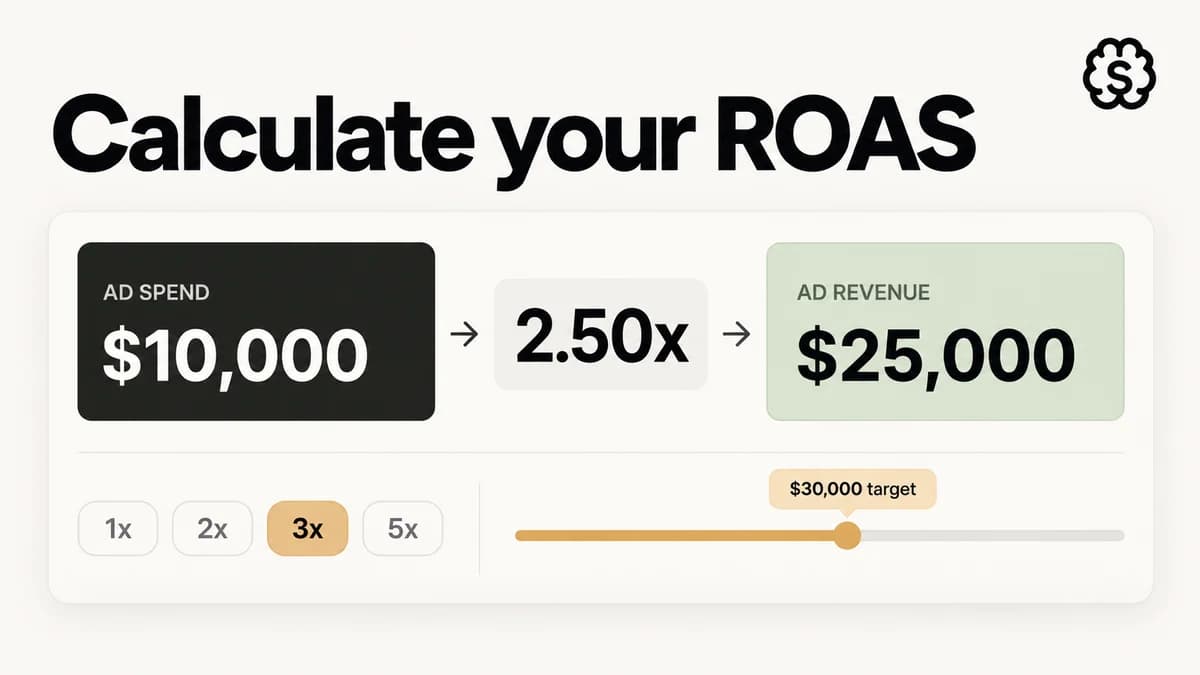
What is break-even ROAS?
Break-even ROAS is the return on ad spend at which an order makes you exactly $0: revenue in equals all costs out. Above it, every order adds profit. Below it, you are paying Meta or Google for the privilege of shipping boxes.
Contribution margin is what's left of the order value after every variable cost except ads: landed product cost, shipping and fulfillment, payment processing, and any other per-order cost. It is the pool of money each order gives you to buy traffic with.
Worked example
Take the calculator's default numbers: an $80 order with $22 landed product cost, $8 shipping and fulfillment, 2.9% + $0.30 payment processing ($2.62 on an $80 order), and $2 of other variable costs.
$80 ÷ $45.38 = 1.76 break-even ROAS
At a 1.76 ROAS this brand breaks even. At a 2.5 ROAS it keeps $13.38 of every order (a 16.7% net margin before fixed costs). At a 4.0 ROAS it keeps $25.38. That is why two brands can look at the same in-platform ROAS and one is scaling while the other is quietly bleeding: the number that matters is yours, not a benchmark.
What to include in each input
Product cost (COGS): the landed cost of everything in the order: unit cost, inbound freight, duties. Use your blended per-order figure, not the cheapest SKU.
Shipping & fulfillment: outbound postage, pick-and-pack fees, and packaging materials. If you charge customers for shipping, either add that revenue to AOV or net it out here. Just don't count it twice.
Payment processing: your PSP's blended rate. 2.9% + $0.30 is the common card default; adjust if most volume runs through wallets or installments with different pricing.
Other variable costs: free gifts and inserts, expected refund and chargeback cost per order, per-order support. Skip fixed costs: salaries, software, rent. Break-even ROAS is a contribution metric; fixed costs decide how many profitable orders you need, not whether an order is profitable.
Break-even ROAS vs. break-even CPA
The same math read two ways. Break-even CPA is simply your contribution margin: the most you can pay for an order before it loses money ($45.38 in the example). Media buyers who bid on cost caps tend to think in CPA; finance tends to think in ROAS. The calculator shows both so the media buying target and the P&L agree by construction.
New-customer ROAS vs. blended
Run this calculator twice if you have meaningful repeat purchase behavior. Against first-order economics it tells you what prospecting must clear on its own. Against 60- or 90-day value per customer it tells you how far you can lean on LTV. That is a deliberate choice about payback period, not a free pass. Most DTC teams hold prospecting near first-order break-even and let retention own the rest.
Frequently asked questions
What is a good ROAS for a DTC brand?
There is no universal number; that is the point of calculating your own break-even. A 3.0 ROAS is fantastic for a 56%-margin brand and underwater for a 25%-margin brand. Set your target as break-even plus the net margin you want; the profit table above does that math per order.
Should I include fixed costs like salaries and software?
No. Break-even ROAS is a per-order contribution metric. Fixed costs determine how many contribution-positive orders you need each month to cover overhead, which is a volume question, not an ads-efficiency question. Mixing them in produces a target that punishes scale.
Why does my ad platform show a higher ROAS than my books?
In-platform ROAS is attributed revenue, which double-counts across channels and windows. Your true blended check is MER (total revenue ÷ total ad spend). Use platform ROAS for relative decisions between campaigns and this calculator plus MER for the honest business answer.
How does this work for subscription products?
Decide which order you are willing to break even on. Enter first-shipment economics to demand day-one payback, or enter expected value over your payback window (e.g., 90-day revenue per new subscriber) to allow a deliberate front-end loss. Write the choice down: it is your real risk policy.
Is break-even ROAS the same as break-even MER?
The formula is identical; the scope differs. Applied to one campaign's attributed revenue it is ROAS. Applied to total store revenue over total ad spend it is MER. This calculator gives you the per-order economics that make either version meaningful.
What should I do if my break-even ROAS is above 3?
A break-even above ~3 means thin contribution margins, and paid social will punish that. Before buying more traffic: raise AOV (bundles, post-purchase upsells), renegotiate landed costs, or reprice. Dropping break-even from 3.3 to 2.4 does more for scale than any targeting change ever will.
Where StefanBrain fits
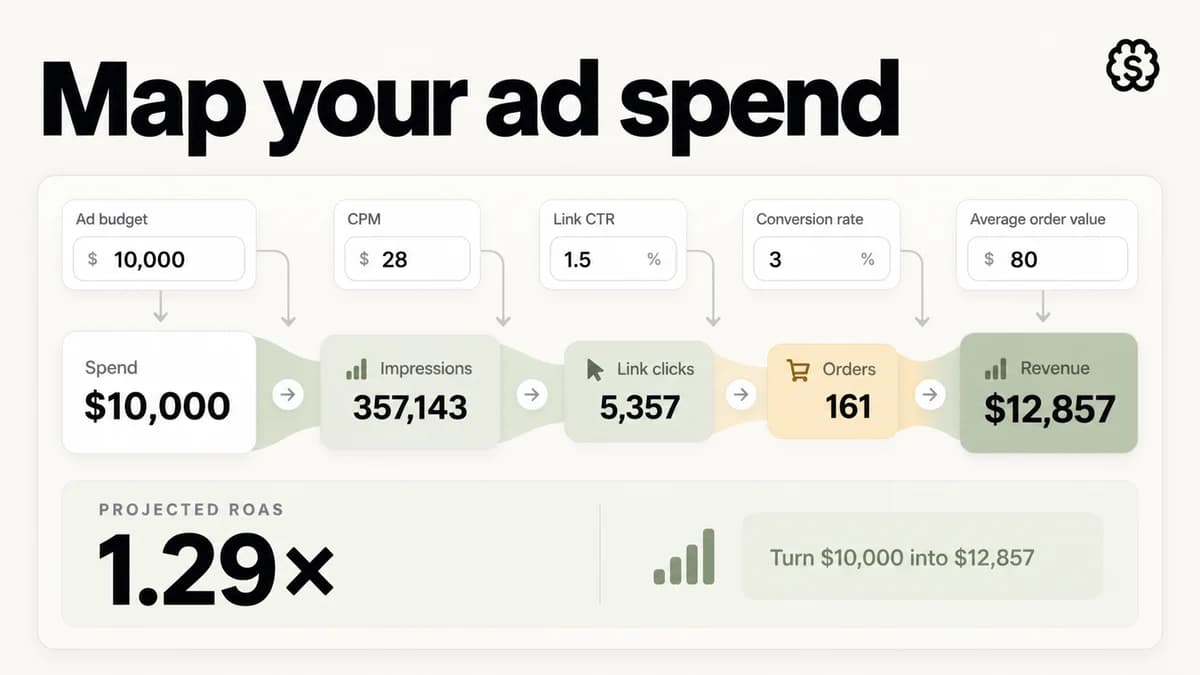
This calculator hands you the target; clearing it is a creative problem. StefanBrain generates the static ads, video ads, landing pages, and copy tests that move CTR and conversion rate, then pushes winners to Meta and reads the results back. Pair it with the Ad Spend Calculator to see whether a media plan clears the ROAS you just computed.