CPA Calculator

Enter spend and conversions to get your cost per acquisition, or flip the solve to see what a budget buys at a target CPA, and what a goal costs.

Cost per acquisition

$62.50

Spend ÷ conversions: what one purchase or lead costs you.

Try:
Solve for
$

Total ad spend for the period: the Amount spent column in Ads Manager.

Purchases (or qualified leads) from the same period, not add-to-carts. Count one event.

  1. Spend

    $5,000

    what you paid

  2. Conversions

    80

    what it bought

  3. CPA

    $62.50

    cost per conversion

Conversions per $1,000

16

What each $1,000 of spend buys.

Spend

$5,000

Conversions

80

Count one conversion event consistently: purchases for e-commerce, qualified leads for lead gen. Mixing events makes every CPA comparison meaningless.

What is CPA?

CPA, cost per acquisition, is what one conversion costs you in ad spend. It is the media buyer's unit price: not what the traffic cost, not what the clicks cost, but what the outcome cost.

CPA = Spend ÷ Conversions
Conversions at target = Budget ÷ Target CPA
Budget for goal = Target CPA × Conversions goal

All three lines are the same equation solved for a different unknown. Measuring a live campaign? Solve for CPA. Planning what a budget can deliver? Solve for conversions. Working backwards from a sales target? Solve for budget.

One scoping note: CPA is a campaign and channel metric. It counts whatever conversions the ads got credit for, new customer or not. That makes it the right dial for steering media day to day, and the wrong one for judging the whole business, which is CAC's job. The FAQ below covers the difference.

Worked example

The defaults model a month of prospecting: $5,000 of spend that produced 80 purchases. $5,000 ÷ 80 = $62.50 CPA. Read it as a rate and it says every $1,000 of spend is buying 16 customers.

Flip to Conversions mode to plan the next month. The same $5,000 budget at a $45 target CPA affords 111.1 conversions ($5,000 ÷ $45). Flip to Budget mode to work backwards instead: a 200-conversion goal at that $45 target needs a $9,000 budget ($45 × 200).

Notice the built-in tension. The account is currently buying customers at $62.50 while the plan assumes $45. That $17.50 gap per conversion is the actual work, and no amount of budget arithmetic closes it. The sections below cover where a $45 target should come from, and which levers move a $62.50 actual toward it.

CPA vs. break-even CPA

A CPA means nothing on its own. $62.50 is excellent for a $250 skincare bundle and a slow bleed for a $60 gadget. The line that separates them is break-even CPA: the contribution margin an order leaves after product cost, shipping, and payment fees. Pay less than that per order and ads make money; pay more and they don't.

Say an $80 order leaves about $45 after variable costs. Paying $62.50 per customer loses roughly $17.50 on every first order, which the platform dashboard will happily never mention. Compute your own line with the Break-Even ROAS Calculator. It outputs break-even CPA directly from your unit economics. Set your target CPA at or below that number for day-one profit, or deliberately above it if repeat purchases pay the difference back.

Which conversions should you count?

Purchases. Not add-to-carts, not initiate-checkouts, not landing page views. Upper-funnel events often run 3–10× cheaper than purchases, so counting them produces a flattering CPA that no P&L will ever confirm. For lead gen, the same rule applies one level up: count qualified leads, not form fills from people who typo'd their email.

Watch the platform's “Results” column: it reports whatever event each campaign optimizes for, so a mixed account shows a column of numbers that aren't the same unit. Pick one conversion event, build a custom column for it, and hold every campaign to it. A CPA you can't compare across campaigns is trivia, not a metric.

Also decide the attribution window once and stop moving it. A 7-day-click CPA and a 1-day-click CPA from the same campaign can differ by half, and switching between them mid-test lets you “improve” any number without changing anything real. Whichever window you pick, enter the matching spend and conversions into the calculator. Mixing a month of spend with a week of conversions is the most common way this math goes wrong.

The levers that actually lower CPA

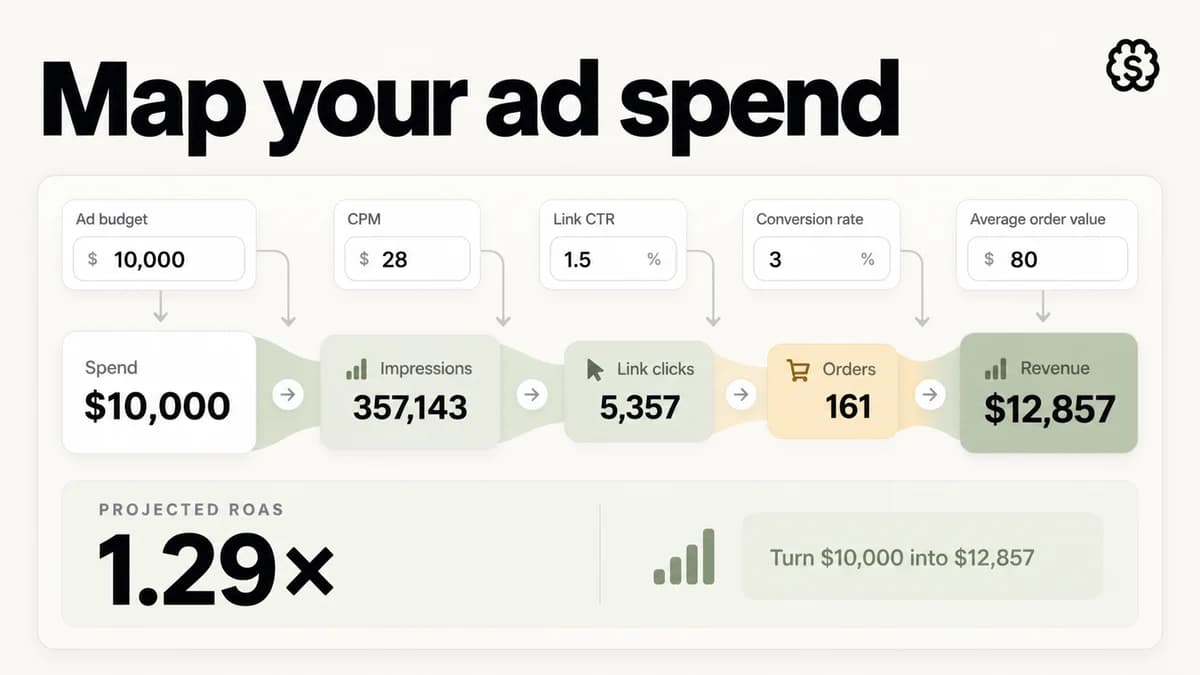
CPA decomposes into three parts: CPM ÷ (CTR × CVR), scaled per thousand. The default chain in our Ad Spend Calculator ($28 CPM, 1.5% CTR, 3% conversion rate) lands at a $62 CPA, which is exactly the neighborhood of this page's example. That decomposition tells you where the leverage lives.

CPM is mostly rented from the auction; you influence it at the margins. CTR and CVR are yours. Because they multiply, a 30% lift in each cuts CPA by roughly 41%: that is $62.50 dropping under $37 from creative and landing page work alone. Meanwhile bid tinkering, audience shuffling, and campaign-structure rebuilds mostly move spend between line items with the same underlying CTR and CVR. When an account review says “lower the CPA,” the honest translation is almost always “ship better creative and a faster page.”

Concretely, that means testing hooks and angles until one clears your account's CTR baseline, matching the landing page's first screen to the ad's promise, and cutting page weight until it loads before attention lapses. Each of those is boring, none of it is a bidding trick, and together they are where CPA is actually won.

Frequently asked questions

What's the difference between CPA and CAC?

CPA is ad spend divided by conversions: any conversion, including returning customers, usually per channel. CAC is customer acquisition cost: total acquisition spend divided by new customers only, often loaded with agency fees and tools. A brand with heavy repeat purchase can show a $40 CPA and a $90 CAC at the same time. Use CPA to steer campaigns and CAC to judge the business.

What is a good CPA?

There is no universal benchmark. A good CPA is defined by your margins, not your industry. The honest anchor is break-even CPA: the contribution margin one order leaves behind. A CPA 20% under that line funds growth; one 20% over it is renting revenue. Compute the line first, then judge the number.

Why is my real CPA higher than what the platform shows?

Platforms count attributed conversions, which include orders that would have happened anyway: brand-search clicks, view-through credit, retargeting of people already in checkout. Divide total spend by total new orders from your store data and the blended CPA is usually meaningfully higher than the dashboard's. Treat platform CPA as a relative signal between campaigns and blended CPA as the truth.

Should I set cost caps at my target CPA?

Start looser. A cost cap at exactly your target tells the auction to skip most of the market, and delivery often stalls before the algorithm learns anything. A common approach is to launch with a cap near break-even CPA (your true ceiling), let it spend, then tighten toward target in steps. If a cap can't spend at all, the problem is the creative, not the cap.

Is CPA the same as cost per result?

Only when the “result” is the conversion you actually care about. Cost per result is the platform's label for spend divided by whatever event that campaign optimizes toward, which might be link clicks, leads, or add-to-carts. A prospecting campaign optimizing for add-to-carts will show a flattering cost per result and no comparable CPA. Build a custom cost-per-purchase column and read that instead.

How many conversions do I need before CPA is readable?

Rough rule: don't judge anything on fewer than ~50 conversions per campaign or test cell, and prefer 100. At the example's $62.50 CPA, 50 conversions means about $3,125 of spend per cell before the number stabilizes. Below that, a single good or bad day swings CPA by double digits and you'll be reacting to noise.

Where StefanBrain fits

This calculator tells you what a conversion costs; lowering that number is creative and landing page work. StefanBrain generates the static ads, video ads, and page copy that move CTR and conversion rate, launches them to Meta, and reads results back, all trained on 7+ years of DTC marketing IP. And when you want the business-level view of the same question, the CAC Calculator shows what a new customer truly costs once every acquisition dollar is counted.

More free tools

Knowing your CPA is step one. Cutting it is the job.

StefanBrain generates the ad creative, copy, and landing pages that move CTR and conversion rate, the two numbers your CPA is made of, and pushes winners straight to Meta.

Built for brands serious about growth.