What is ROAS?
ROAS, short for return on ad spend, is revenue divided by the ad spend that produced it. A 2.50 ROAS means every $1 of spend came back as $2.50 of revenue. It is the fastest read on whether a campaign, an ad set, or a whole account is pulling its weight.
Spend share of revenue = Ad spend ÷ Revenue
Allowed spend = Revenue ÷ Target ROAS
Two framings, same math. Forward: you spent, revenue came in, ROAS scores it. Backward: you already know the ROAS you must hold, so revenue divided by that target is the most you can spend.
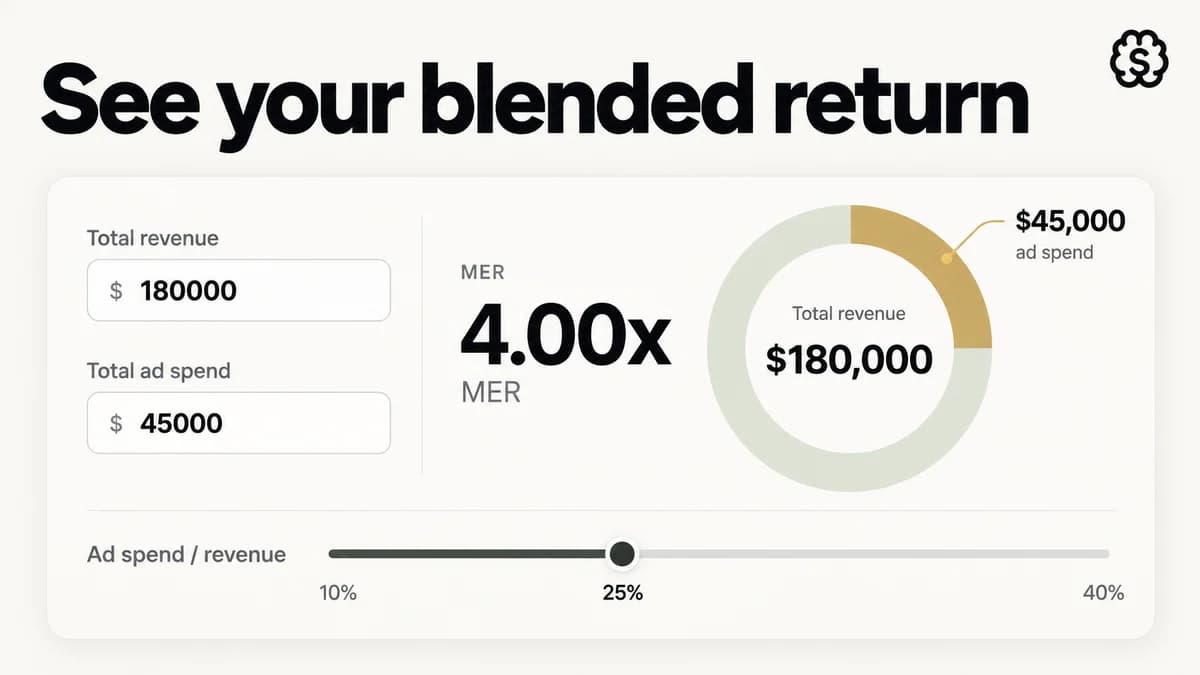
Be precise about scope before you trust the output. Platform ROAS uses revenue the ad platform attributes to itself. Blended ROAS uses total store revenue over total ad spend, usually called MER. Same formula, very different numbers, and the gap between them is where most ROAS arguments start.
Worked example
Take the calculator's defaults: $25,000 of revenue on $10,000 of ad spend.
$10,000 ÷ $25,000 = 40% spend share of revenue
Every dollar of spend returned $2.50 of revenue, and ads consumed 40 cents of every revenue dollar. Now flip to allowed-spend mode: if you must hold a 3.0 ROAS and expect $25,000 of revenue, the ceiling is $25,000 ÷ 3 = $8,333.33, which is 33.3% of revenue. Spend past that and the target breaks, even though revenue grew.
Is 2.50 good? Wrong question. A brand with a 40% contribution margin breaks even at exactly 2.50 (1 ÷ 0.40): ads take 40% of revenue and margin is 40% of revenue, so every order nets $0. A 55%-margin brand keeps $15 of every $100 at the same number. Same ROAS, opposite verdicts. That is why the margin section below matters more than the headline result.
Why in-platform ROAS runs hotter than your books
Ads Manager almost always reports a higher ROAS than your bank account experiences. Three mechanisms do the inflating:
Attribution windows. The common default counts any order within 7 days of a click, including orders from repeat customers who would have bought anyway. Widen the window and ROAS rises without a single extra sale existing.
View-through conversions. With 1-day-view enabled, someone who scrolled past your ad, never clicked, and bought that evening is credited to the ad. Some of those are real influence; plenty are coincidence wearing a lanyard.
Cross-channel double counting. A customer sees a Meta ad, later clicks a branded Google search ad, and buys once. Meta claims the order, Google claims the order, and your blended ROAS is the only report that refuses to count it twice. Each platform grades its own homework.
None of this makes platform ROAS useless. It is fine for relative calls: this campaign versus that one, this creative versus the last. But for the honest account-level answer, check it against your MER: total revenue over total spend, which nothing can double-count.
Set the target from margin, not folklore
Most ROAS targets are inherited: a former boss liked 3.0, a Slack group swears by 4.0. The only defensible target starts from your unit economics: break-even ROAS is AOV divided by contribution margin per order, and everything above it is profit. Run the Break-Even ROAS Calculator first; it turns your real costs into the floor this page's target mode should sit above.
Then the target has meaning. A 3.0 target at a 40% margin says: per $100 of revenue you spend $33.33, keep $40 of margin, and earn $6.67, a 6.7% net before fixed costs. If that is thinner than you want, the fix is a higher target, a higher margin, or both. A target picked without this arithmetic is a vibe with a decimal point.
Frequently asked questions
What is a good ROAS for a DTC brand?
It depends on margin, the one thing ROAS ignores. A 70%-margin brand breaks even below 1.5; a 25%-margin brand needs 4.0 just to stop losing money. That is arithmetic, not opinion. Compute your own break-even from real costs, add the net margin you want, and that sum is your good ROAS.
What is the difference between ROAS and MER?
Scope. ROAS is usually per-campaign or per-platform, built on attributed revenue. MER (marketing efficiency ratio) is total store revenue divided by total ad spend across everything, immune to attribution games because it counts every order exactly once. Use ROAS to compare campaigns and MER to know whether the whole machine is profitable.
What is the difference between ROAS and ROI?
ROAS is a revenue ratio; ROI is a profit ratio. ROI subtracts costs first, computed as (gross profit − ad spend) ÷ ad spend, so it can be negative while ROAS looks healthy. The worked example makes the point: a 2.50 ROAS at a 40% contribution margin is a 0% ROI on ad spend. Finance thinks in ROI; auctions report ROAS.
Why is my in-platform ROAS higher than my books?
Attribution windows sweep in orders that would have happened anyway, view-through credit counts people who never clicked, and multiple platforms claim the same order. Your books count each order once, so they read lower. When platform ROAS and MER drift apart, trust MER for the business answer and use platform ROAS only for relative decisions.
Should I set one ROAS target for all campaigns?
No. Retargeting and branded search post high ROAS partly by claiming orders that were coming anyway; prospecting posts lower ROAS while doing the actual acquiring. One blended target starves the campaigns that create new customers and overfeeds the ones that harvest them. Set targets per intent level, and judge the account on blended MER.
Where StefanBrain fits
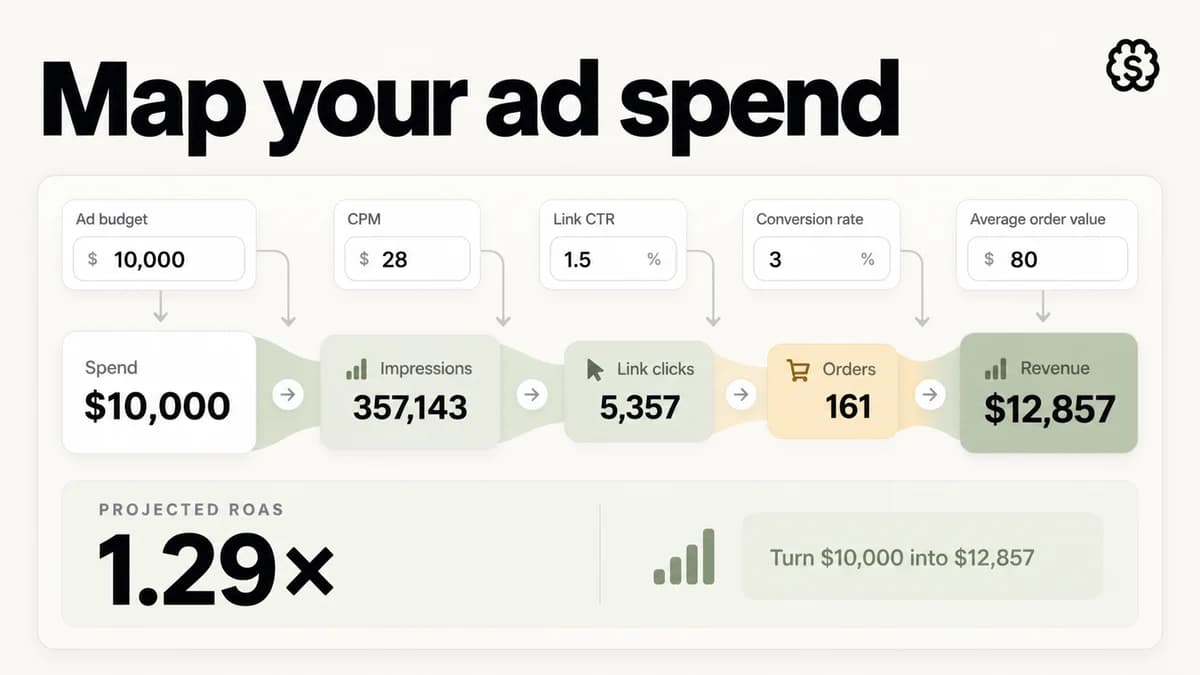
ROAS is a scoreboard; creative is what moves it. StefanBrain generates and iterates the static ads, video ads, and landing pages that change the revenue side of this ratio, launches them to Meta, and reads the results back. Once you have a target, use the Ad Spend Calculator to project whether a media plan clears it before you spend a dollar.