What marketing ROI measures
Marketing ROI answers one question: for every dollar of marketing cost, how many cents of profit came back? Not revenue. Profit. That distinction is the whole reason this calculator exists alongside a ROAS calculator.
Net return = Gross profit − Marketing cost
ROI = Net return ÷ Marketing cost × 100
ROAS (same numbers) = Revenue ÷ Marketing cost
ROAS divides revenue by spend and stops there. ROI first converts revenue into the profit it actually contains, then subtracts what the marketing cost you. Two campaigns with identical ROAS can sit on opposite sides of zero ROI: margin decides which.
Worked example
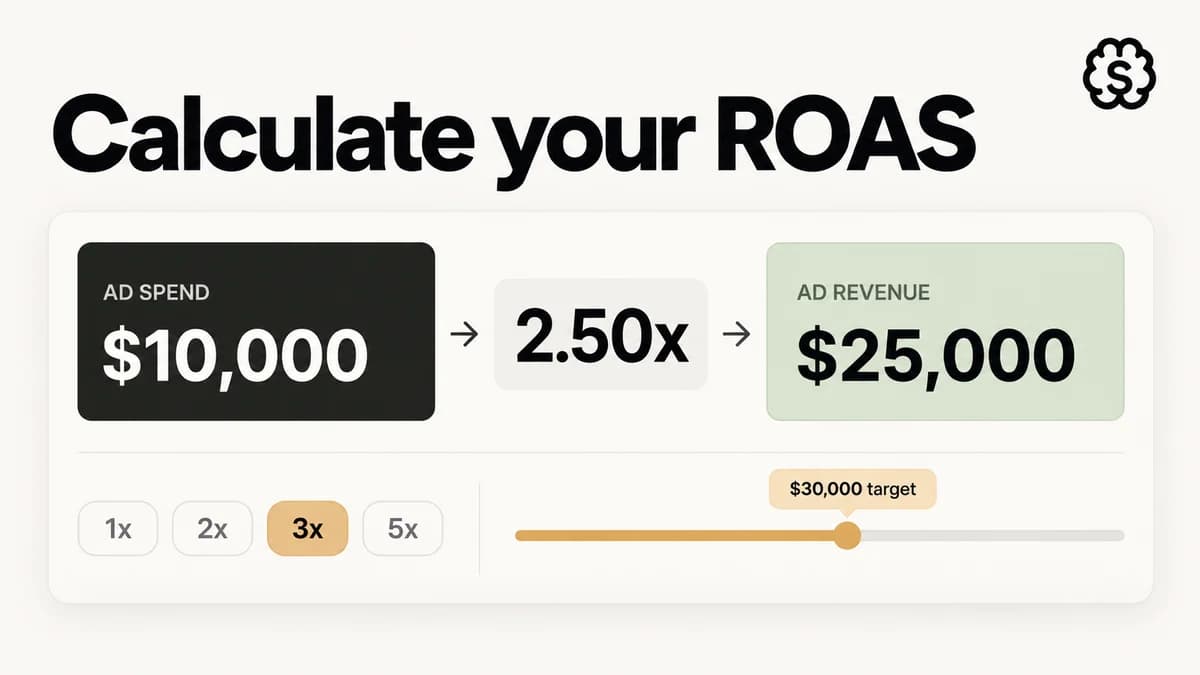
Take the calculator's defaults: $25,000 of attributed revenue at a 55% gross margin, against $10,000 of total marketing cost.
$13,750 − $10,000 = $3,750 net return
$3,750 ÷ $10,000 = 37.5% ROI
The same numbers as a ROAS: $25,000 ÷ $10,000 = 2.50. Notice how different the two readings feel. ROAS says “$2.50 back for every $1”, which sounds like money printing. ROI says you kept 37.5 cents of profit per dollar risked. Both are true. Only one tells you what the P&L will show.
Why a 2.5 ROAS can be a negative ROI
Rerun the example at a 30% margin, common for brands with heavy COGS, paid shipping, or discount-driven checkouts. Revenue and spend are unchanged, so the ads manager still shows 2.50.
$7,500 − $10,000 = −$2,500 net return
−$2,500 ÷ $10,000 = −25% ROI
Same dashboard, same 2.50, and this brand loses $2,500 in the period. At a 2.5 ROAS you need at least a 40% margin just to break even: that is 1 ÷ 2.5 rearranged. At the default 55% margin, break-even sits near a 1.82 ROAS. If you don't know your number, the Break-Even ROAS Calculator computes it from your real unit economics.
What belongs in marketing cost
Most teams enter media spend and stop. That flatters the answer. Cost should include everything the campaign could not have run without:
Media: the platform spend itself, across every channel the revenue is attributed to.
Creative production: UGC creators, editors, design retainers, usage rights. A $2,000 video amortized over one campaign is campaign cost.
Agency and tools: agency fees or the attributable share of them, plus attribution, landing page, and testing software tied to the effort.
Leave out fixed overhead: salaries, rent, Shopify's base plan. ROI on marketing is a contribution question. Overhead decides how much positive-ROI marketing you need, not whether a campaign cleared its own cost.
The incrementality caveat
One honest warning: the revenue field is almost always attributed revenue, and attribution overstates true lift. Platforms claim orders that branded search, email, or plain habit would have delivered anyway. So the ROI this page computes is an upper bound: useful, directional, and flattering.
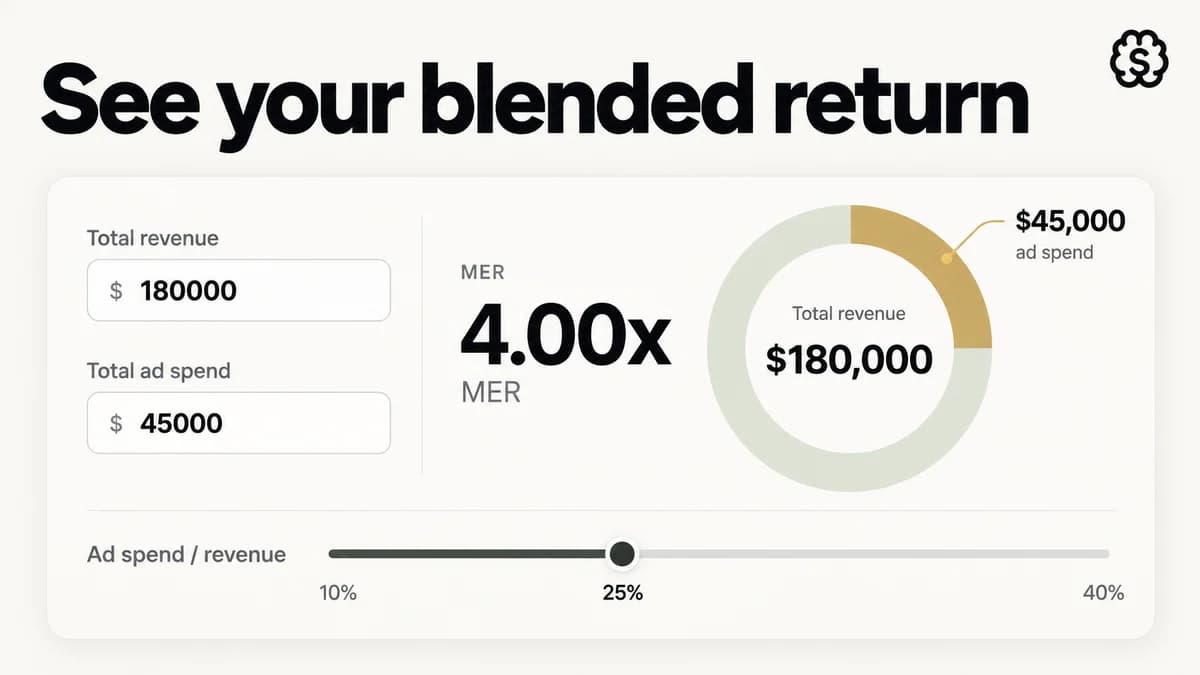
Treat it accordingly. Compare campaigns against each other with it, and track it over time. But before declaring victory on the year, sanity-check against blended numbers: the MER Calculator divides total revenue by total ad spend and cannot be gamed by attribution windows.
Frequently asked questions
What is the difference between ROI and ROAS?
ROAS is revenue ÷ ad spend, a gross efficiency ratio that ignores your margin. ROI is (profit − cost) ÷ cost: it converts revenue to profit first, then asks whether the spend paid for itself. In the worked example above, the identical campaign reads 2.50 ROAS and 37.5% ROI. Use ROAS for fast in-platform decisions; use ROI to know whether the P&L actually improved.
What is a good marketing ROI?
Above 0% the marketing covered its own cost, a real bar many accounts quietly miss. Beyond that, the honest answer depends on your margin, payback tolerance, and how much of the revenue is truly incremental. Directionally, established DTC teams target roughly 20–100% on this contribution-level math and accept lower ROI on new-customer campaigns that repeat purchases repay later.
Which costs should I include?
Everything attributable to the effort: media spend, creative production, agency fees, and the tools that exist because of the campaign. Exclude fixed overhead like salaries and rent. The test: if killing the campaign would erase the cost, it belongs in the denominator.
Can ROI be positive while the P&L suffers?
Yes, three ways. Attribution can inflate the revenue input, so the ROI is real on paper only. Contribution-level ROI can be positive while volume is too low to cover fixed overhead. And cash timing bites: spend leaves the account today, LTV-based “revenue” arrives over months. Positive ROI is necessary for a healthy P&L, never sufficient.
Should I use gross margin or net margin?
Gross margin after all variable costs (COGS, shipping, fulfillment, payment fees) but before fixed overhead. Using revenue (100% margin) turns ROI into ROAS and hides losses. Using fully loaded net margin double-counts overhead into a per-campaign decision. Variable margin is the honest middle.
How do I measure incrementality cheaply?
Holdout tests. Pause a channel in a few matched regions for two to four weeks and compare revenue against the regions still running: the gap is your real lift. Even cruder: turn brand search off for a week and watch total orders. Most teams find true incrementality lands meaningfully below attributed revenue, which is exactly why this page labels its ROI directional.
Where StefanBrain fits
Once you know your real ROI, improving it is a numerator problem: more revenue from the same cost. StefanBrain generates the static ads, video ads, landing pages, and copy tests that move CTR and conversion rate, launches winners to Meta, and reads results back. Set your efficiency floor with the Break-Even ROAS Calculator, then put the system to work clearing it in profit terms.