Four metrics, four questions
Most metric arguments start when someone answers question A with metric B. So pin the questions down first.
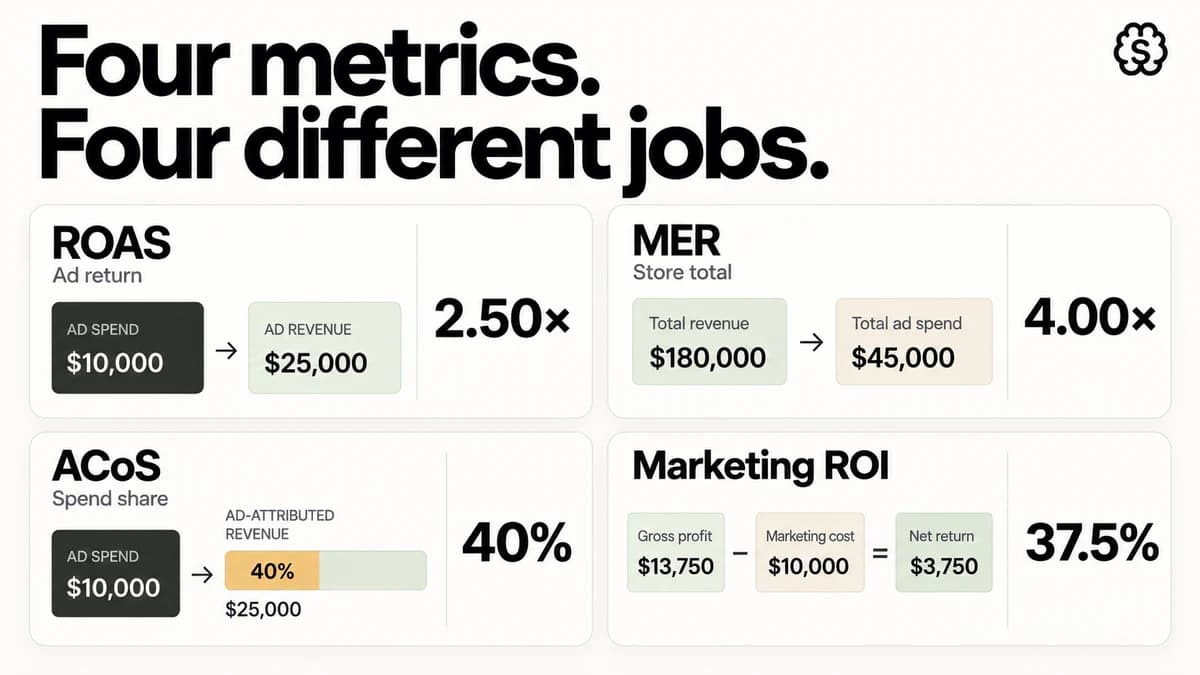
ROAS scores one campaign or channel: attributed revenue divided by the spend behind it. Its question is which campaign deserves the next dollar. MER scores the whole business: total revenue divided by total ad spend, everything in, everything out. Its question is whether the machine is efficient overall. ACoS is the Amazon dialect: ad spend divided by ad revenue, the same fraction as ROAS turned upside down. Its question is what share of each ad sales dollar went back into clicks. ROI is the finance lane: profit after costs, divided by costs. Its question is whether the P&L actually improved.
MER = Total revenue ÷ Total ad spend
ACoS = Ad spend ÷ Ad revenue × 100
ROI = (Gross profit - Marketing cost) ÷ Marketing cost × 100
Same account, four verdicts. The rest of this guide is when to trust which.
ROAS: fast, granular, and inflated
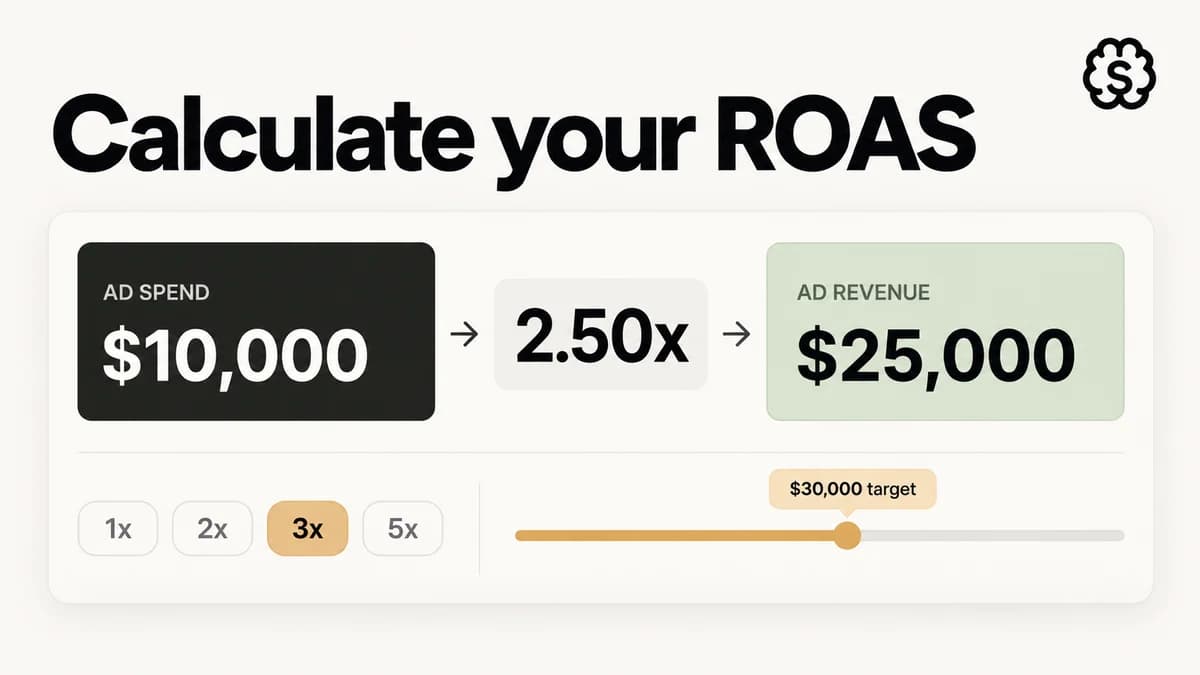
ROAS gives you the quickest verdict on a single campaign. Spend $10,000, book $25,000 of attributed revenue, and you have a 2.50 ROAS: of every revenue dollar the campaign claims, 40 cents went to the ads behind it.
It is also the easiest number of the four to inflate, because the revenue side is the platform grading its own homework. Three mechanisms do the work. Attribution windows sweep in orders placed within 7 days of a click, including repeat customers who would have bought anyway. View-through credit counts someone who scrolled past the ad, never clicked, and bought that evening. And cross-channel double counting lets Meta and Google each claim the same order, once each.
So scope ROAS to what it is good at: ranking things inside the ad account. Which of two campaigns deserves budget, whether the new creative beats the incumbent. The ROAS calculator runs the math both directions, including the spend ceiling a target ROAS allows.
One more trap: 2.50 is not a verdict. At a 40% contribution margin, 2.50 is exactly break-even, since 1 ÷ 0.40 = 2.5. Shrink the margin to 25% and nothing under a 4.0 stops the bleeding; stretch it to 70% and the break-even line drops under 1.5. Same number, opposite verdicts, and only margin decides.
MER: the blended check
MER stands for marketing efficiency ratio: everything the business earned in a period, over everything it spent on ads in that same window, all platforms combined. Neither input comes out of an ads manager; both come off the books, which is why no attribution model can pad the number. Each order is counted once.
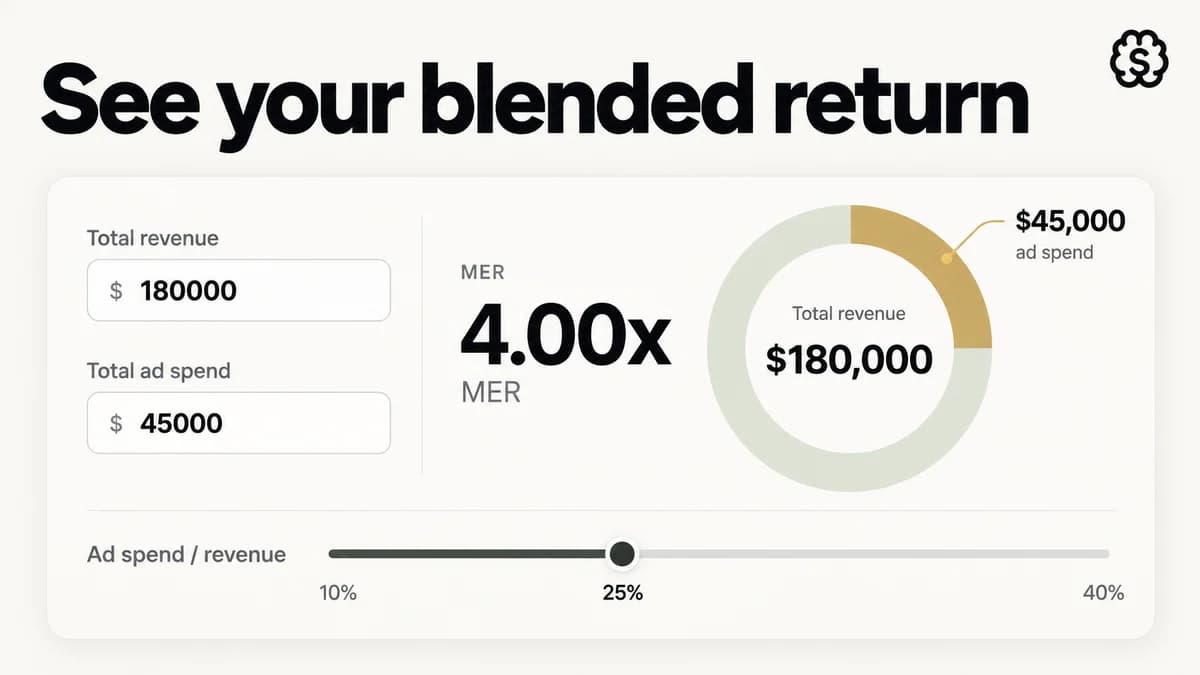
Say the store books $180,000 in a month while ad spend across every platform totals $45,000. That is a 4.00 MER, or 25% of revenue spent on ads. Same fact, two dialects: media buyers say 4.0, finance says 25%. MER also keeps every per-channel claim honest. If the platforms collectively report a 5.2 while the blended ratio reads 2.1, trust the 2.1; it is the number the closed books will reproduce.
The dangerous case is a MER that sinks while every campaign's ROAS stays put, because no dashboard flags it. Push that month's spend up to $55,000 and let revenue land at $190,000. No campaign has to post a worse ROAS for this to happen, yet blended efficiency slides from 4.00 to 3.45. Isolate the change and the verdict is stark: the added $10,000 of spend coincided with exactly $10,000 of added revenue, an incremental MER of 1.0, a losing trade at nearly any margin. Per-channel reporting cheered the scale-up while the blended ratio caught the new dollars merely paying for themselves.
The MER calculator turns your two book numbers into the ratio and the ad-to-revenue percent in one pass.
ACoS and TACoS: the Amazon lane
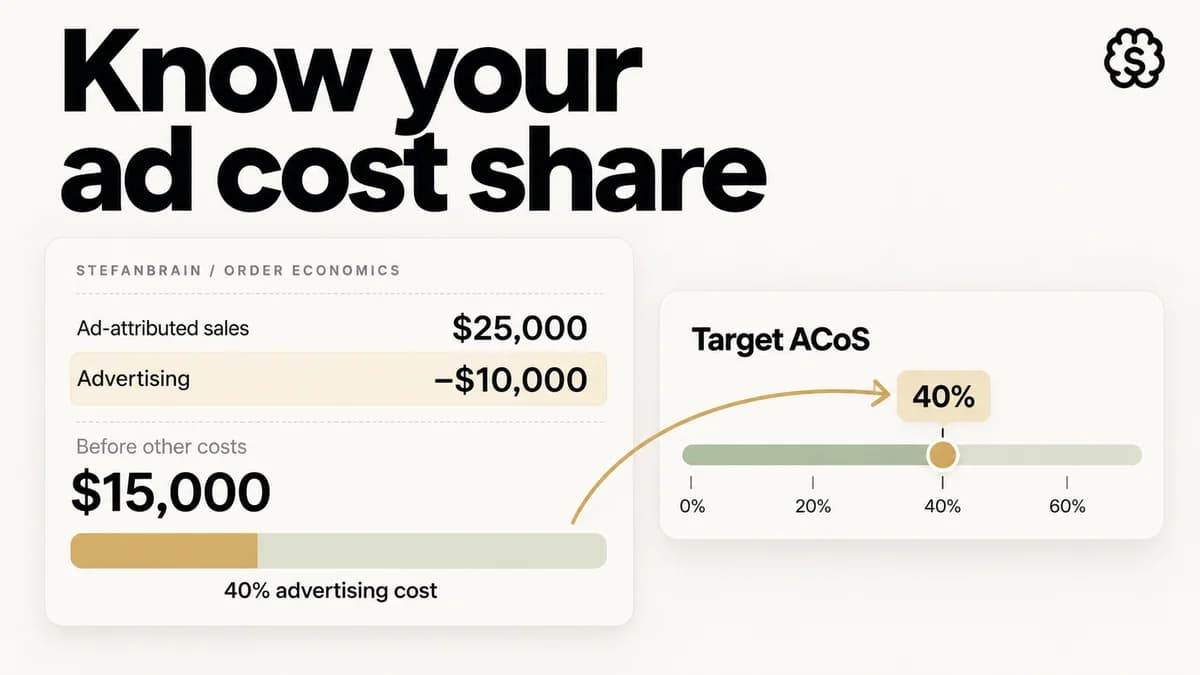
Amazon speaks its own dialect. ACoS stands for advertising cost of sale: take what you spent on ads, divide by the revenue those ads get credit for, and read the result as a percentage. A 25% ACoS says the ads reclaimed $1 of every $4 they brought in.
It is ROAS inverted, and the identity is exact: ACoS equals 100 ÷ ROAS, so a campaign running a 25% ACoS is the same campaign running a 4.00 ROAS. Which dialect a team speaks depends on where it buys media, not on the math: Amazon's console thinks in ACoS, while Meta and Google think in ROAS. So translate goals at that boundary instead of restating them loosely. A 25% ACoS ceiling and a 4.0 ROAS floor pin a campaign to identical efficiency.
Break-even ACoS = post-fee contribution margin %
Break-even is where teams slip. You do not choose a break-even ACoS; your unit economics already chose it. Whatever margin survives landed COGS, referral fees, and fulfillment is the most an order can hand to ads and still net $0. Keep 40% after fees and your zero line sits at a 40% ACoS. Operate at 25% against that line and 15 points of profit survive: out of every $100 in ad sales, product costs and fees absorb $60, the clicks absorb $25, and the remaining $15 stays with you.
TACoS widens the lens: ad spend over total revenue, organic included. The ACoS calculator computes both, plus your distance from break-even. Watch the pairing over time. Falling TACoS with stable ACoS means organic is compounding underneath the ads. Rising TACoS with stable ACoS means paid is renting a growing share of a flat business.
ROI: the profit truth
ROI is the only metric on this page that speaks in profit. It converts revenue into the margin it contains, subtracts the marketing cost, and divides by that cost.
$13,750 - $10,000 cost = $3,750 net return
$3,750 ÷ $10,000 = 37.5% ROI
Those are the same numbers as the 2.50 ROAS from earlier, and the two lenses disagree on the story. Through ROAS, the campaign looks like a money multiplier: $1 in, $2.50 out. Through ROI, each dollar came home with 37.5 cents of actual profit attached. Neither lens is lying. Only the second one forecasts the P&L.
Now rerun it at a 30% margin with revenue and spend unchanged. Gross profit is $7,500, net return is -$2,500, ROI is -25%. The ads manager shows 2.50 the entire time while the brand loses $2,500. The general rule falls out of the same algebra: 1 ÷ 2.5 = 0.40, so a 2.5 ROAS only turns profitable above a 40% margin.
Two rules keep the number honest. Count every cost that exists only because the campaign ran: media, creative production, agency fees, and campaign tools, but never fixed overhead. And remember the revenue input is attributed, so the ROI you compute is a ceiling, not a floor. The marketing ROI calculator shows ROI and ROAS side by side from the same three inputs.
A simple operating rhythm
Put the four together and a rhythm falls out, one metric per altitude.
Daily: per-channel ROAS, for relative calls only. Which campaign gets the next dollar, which creative dies. Never read the daily number as a business verdict.
Weekly: MER, as the spend governor. Channel ROAS splits the budget; MER decides how big the budget is. Derive the floor from unit economics: break-even MER is 1 divided by contribution margin rate, so 2.22 at a 45% margin and 3.33 at 30%.
Monthly: ROI on contribution math, for structural decisions. Whether the period's marketing cleared its own cost after margin, and whether to change the plan rather than the bids. On Amazon, run the same split one lane over: ACoS per campaign, the TACoS trend for the flywheel.
Every one of those verdicts depends on an input none of the four metrics contains: your margin. Compute it once from real unit economics with the break-even ROAS calculator and every target above stops being folklore.
Where StefanBrain fits
Every metric here is a scoreboard, and scoreboards do not move themselves. The revenue side of all four ratios comes down to the same two levers: creative that earns attention and pages that convert it.
That is the job StefanBrain does. It generates static ads, video ads, and landing pages, then pushes approved batches straight to your ad account through bulk Meta publishing. Performance flows back into the same loop, so the next test starts from what the last one proved. You watch the four numbers. It moves them.