
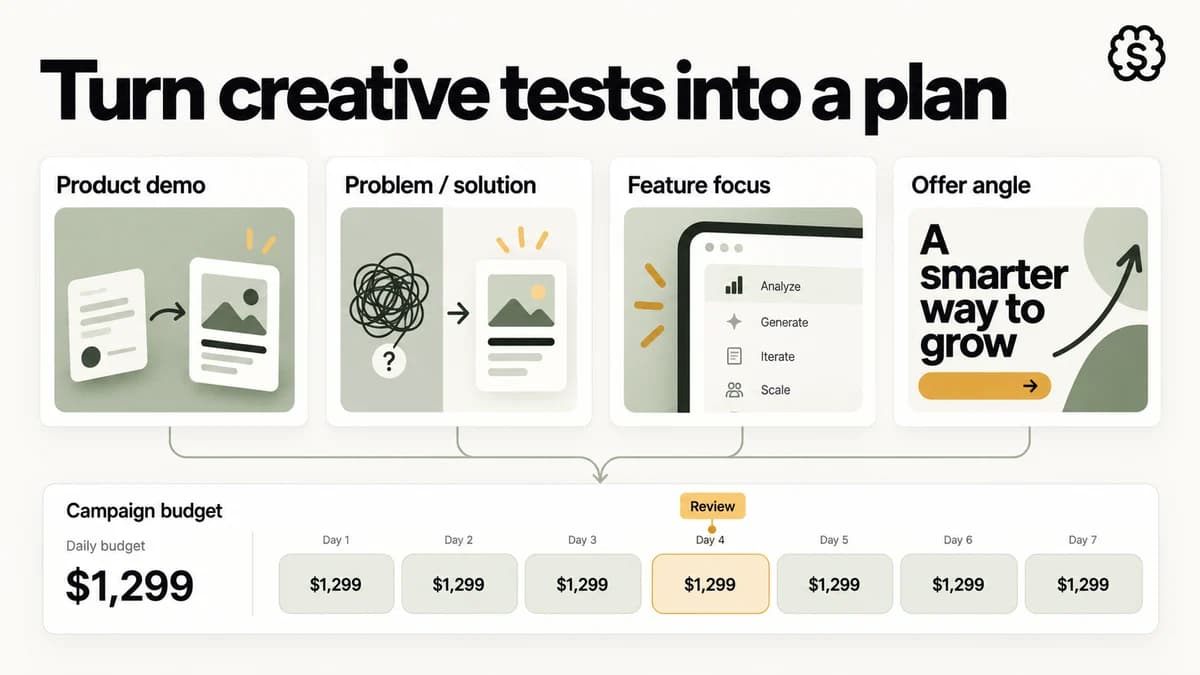
Why most creative tests are unreadable
Picture the usual month. Five new ads go live on leftover budget, and by week four each one carries a CPA. None of those numbers deserve trust yet, because none of the cells collected enough orders to hold still.
Stability is a denominator problem. With 10 orders on the board, one stray conversion bends a cell's CPA by 9%. One hot three-order day bends it by 23%, enough to swap first and third place on the leaderboard. With 50 orders banked, that same day is worth under 6%, and the leaderboard stops shuffling. That is the entire case for the 50-order floor.
Dishonest counting compounds the noise. A concept is a genuinely new bet: a fresh angle, offer, or format. A variation is the same bet in new clothes, a different opening on an unchanged body, and it rides inside its parent's cell. Audit an “eight-concept test” this way and it often shrinks to three real bets.
So size in the opposite direction from habit. Price one trustworthy answer first, then divide your budget by that price to learn how many bets it carries. A few cells finished beat a spread of almosts you quietly relitigate next quarter.
The 50-orders rule and what it costs
The floor slides with the stakes. A coarse keep-or-cut call can settle for around 30 orders. A verdict that reprices a hero product deserves 75 or more. Fifty is the working default between those poles, and it is what the numbers below assume.
At the defaults, a $62 expected CPA and 50 orders price one answer at $3,100, so a four-concept slate runs $12,400. On $400 a day, that is a 31-day commitment; at $800 a day, 15.5 days. The Creative Testing Budget Calculator runs this arithmetic live on your inputs, and the only speed levers it offers are concept count and daily spend. Nothing else shortens the wait.
Two inputs decide whether the sizing is honest. Feed it the CPA of the traffic you will actually buy, usually cold prospecting, which prices higher than the blend retargeting sweetens. The CPA Calculator turns raw account data into that figure: $5,000 across 80 purchases is a $62.50 CPA. And pick a daily number you can defend for the whole run. Cut the default test off at day 18 and $7,200 has bought four cells stranded near 29 orders apiece, close enough to tease and too thin to trust.
The formal version: sample size math
The 50-order floor is a media buying convention, not statistics. When a decision is expensive enough to demand a formal verdict, size it with the A/B Test Sample Size Calculator instead. It asks for a minimum detectable effect, or MDE: the smallest lift worth catching.
Get the MDE type right first. Relative MDEs scale off the page they describe. Asking a 3% baseline for a 20% lift means catching 3.6%, a 0.6-point move in absolute terms. An absolute MDE only means something next to its own baseline, so divide by that baseline before comparing pages. With the standard 95% significance and 80% power, the 3% to 3.6% test needs 13,914 visitors per variant. That is 27,828 total, about 5.6 days at 5,000 daily visitors.
On the same 3% page, hunting a 40% swing takes 3,782 visitors per variant, while hunting 10% takes 53,211. Low-traffic accounts should therefore spend their slots on changes that could plausibly clear a 30-50% MDE: a new offer, a new angle, a rebuilt opening. Button colors never justify the traffic. Ad creative also earns one honest discount, because a bad ad is paused within days rather than shipped into the site. Drop to 90% confidence and the per-variant bill falls from 13,914 visitors to 10,960. Set the bar by the price of a wrong call.
Reading results without fooling yourself
When a test finishes, run it through the A/B Test Significance Calculator. It applies a two-proportion, two-tailed z-test: pool both variants, compute the standard error, and ask how surprising your gap would look if no real difference existed.
A concrete case: variant A converts 144 of 4,800 visitors, a 3.00% rate. Variant B converts 180 of 4,800, so 3.75%. That is a 25% relative lift with a p-value near 0.042, significant at 95.8% confidence. Trim B to 170 conversions and the lift, still pointing the same way, stops being significant. Most “winners” live that close to the line.
Two traps eat the rest. The first is peeking: check the dashboard daily, stop at the first green light, and your false-positive rate runs far past the advertised 5%. Each look gives noise one more chance to cross the line.
The second trap is confusing significant with meaningful. Force enough traffic through and even a hairline lift eventually clears the bar: real, and still too small to pay for shipping it. The reverse bites harder. A null result says unproven, not identical, and underpowered tests bury genuinely promising variants. Translate every verdict into orders and dollars before you ship or kill anything.
Kill on proxies, promote on orders
A full read is expensive, so reserve it for ads that might deserve one. Long before orders accumulate, the upstream gauges report in. A single day of delivery yields enough impressions to read hook rate, the share of impressions that survive your first three seconds. A few hundred clicks are enough to price CPC. The Hook Rate Calculator covers the formula and the benchmarks; on Meta feed and Reels, healthy sits between 20% and 30%.
Write the kill criteria before launch. A hook rate stuck near half the account norm, with a couple of days of spend behind it, is a verdict. So is 2-3× the expected CPA spent without a single order. Paying 50 orders to hear either verdict twice buys nothing. Kill the cell and hand its leftover budget to the concepts that earned more time.
The rule only runs one direction. Upstream metrics can disqualify a concept; they can never promote one. Paid social is crowded with ads that stop thumbs and never sell anything. A hot hook rate buys exactly one thing: the right to keep spending toward a full read. Promotion is settled in orders.
A cadence the budget can actually keep
Now hold the sizing math against a calendar. Spending $400 a day compounds to roughly $12,000 a month, while the default four-concept test costs $12,400. One cycle swallows the whole month. Wanting 8 new concepts a month at that $62 CPA doubles the bill to $24,800, with scaling still unfunded.
A cadence that survives this math is a loop, not a launch calendar. Early in each cell's life, read only the upstream gauges, and only to kill wide gaps backed by real delivery. Narrow gaps get more days; canyon-sized ones get the axe. Mid-run, the budget is untouchable, because siphoning test spend into scaling is how day-18 corpses happen. At n, read once, promote in orders, and refill the empty slots.
For most DTC accounts, the ceiling settles at two to four concepts per cycle, each carried to a full read, with variations nested inside their parents. The cheapest variation in paid social is the hook swap: shoot one body, then cut three to five different openings onto it. Above the ceiling, spend stops being the constraint. Production speed becomes the bottleneck, and no budget line fixes that.
Where StefanBrain fits
Everything above prices the answer. Producing a concept worth its $3,100 read is the other half of the job, and it is the half StefanBrain does. It generates Meta-ready static ads in minutes, each concept built around one testable variable: the hook, the angle, the offer, or the visual pattern. When two ads differ by exactly one variable, the winner tells you why it won.
For video ads, one brief returns a shippable cut in minutes, then hook-led, demo-led, and proof-led variations of the same concept. Your test starts with 3 contenders instead of 1 guess, and your testing calendar becomes the budget math above instead of a production queue.


