
Why five numbers decide whether you can buy growth
Every DTC brand that scales on paid social runs on the same stack of five numbers. Contribution margin prices a single order. Break-even ROAS flips that margin into an ads target. LTV extends it across a customer's repeat orders. CAC is the price you paid for that customer. Payback marks the month the cash returns.
They are not independent. They are one calculation passed down a chain. Margin feeds break-even. Margin and repeat behavior feed LTV. LTV and CAC feed the ratio, and the same inputs feed payback. Get the first number wrong and the mistake compounds through every target after it.
That chain is why two brands can buy the same customers at the same price and end up in opposite places. At a 60% margin rate the account compounds; at 30% it drains. Nothing inside Ads Manager made that call. The unit economics settled it before the first dollar of spend.
Contribution margin: the number everything else inherits
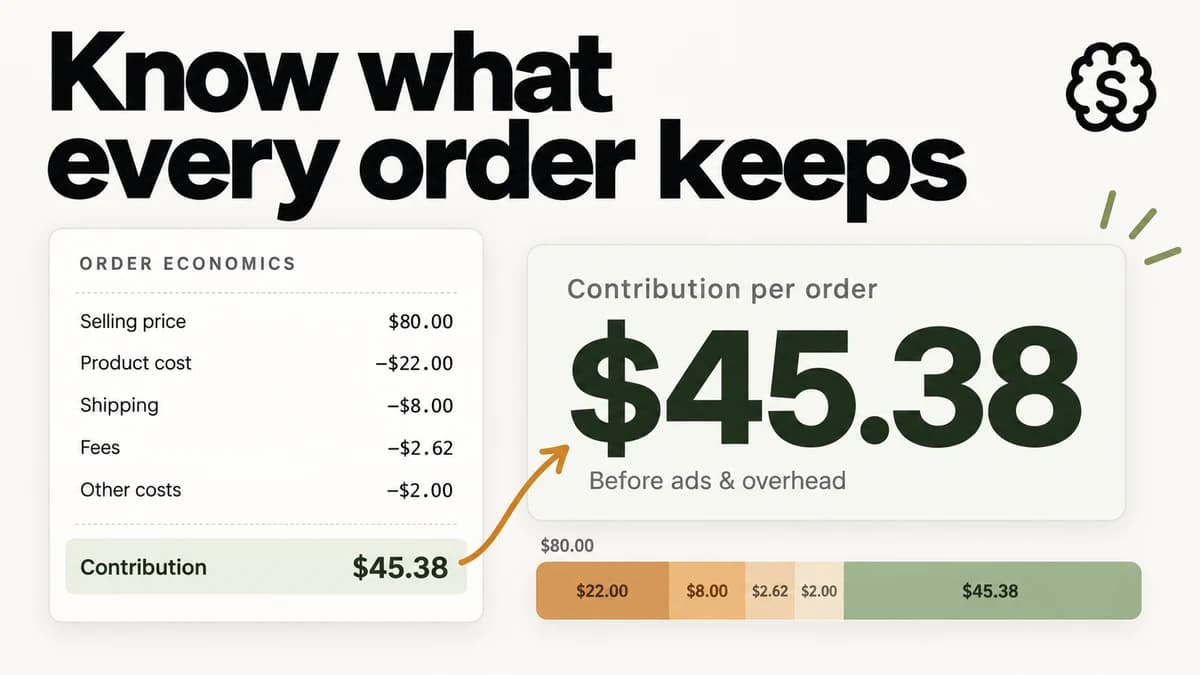
The chain starts with contribution margin: price minus every cost that only exists because the order shipped, with ads and fixed costs excluded. The Contribution Margin Calculator teaches the inputs one by one (landed COGS, fulfillment, processing, the per-order stragglers); this guide only needs its output. On the calculator's default $80 order, $34.62 of variable cost comes out and $45.38 stays, a 56.7% margin rate.
Two properties of that number matter downstream. First, it must be contribution margin, not gross. Gross margin on the same order reads $58 and a comfortable 72.5% because it stops at COGS. The $12.62 it skips still gets spent on fulfillment and fees. A CPA target built on the gross figure quietly overpays by that much. Second, the rate has to leave room for the auction. The DTC accounts that hold up on Meta and TikTok usually carry a margin rate in the mid-50s or better. Once it slips under about 40%, everyday movement in CPMs and conversion rates can push the whole account into the red.
Everything below runs on that $45.38. Compute your own version from real per-order costs before reading on; a wrong margin here corrupts every target that follows.
Break-even ROAS: margin flipped into an ads target
Break-even ROAS is the first hand-off. Divide AOV by the margin you just computed and you get the ROAS at which an order nets to zero. Anything above that line is profit; anything under it means the only party earning on the sale is the ad platform.
On the worked order: $80 ÷ $45.38 = 1.76. Notice what the conversion buys you: benchmarks stop mattering, because the target came from your own costs. A 2.5 ROAS leaves this brand $13.38 per order and a 4.0 leaves $25.38. A brand with half the margin rate can post the same 2.5 and lose money on every sale.
The margin doubles as a CPA ceiling: with $45.38 of contribution in each order, $45.38 is the most an acquisition can cost before the order turns negative. That is the form of the target a cost-cap media buyer actually bids with, while finance reasons in ROAS. The Break-Even ROAS Calculator derives the pair from one set of inputs, with per-order profit at the usual ROAS targets, so neither side is working from a different number.
LTV and CAC: value in, cost out
LTV carries the margin logic across repeat purchases, and which version you compute decides whether the number can be trusted. Count a customer's raw spend and you have revenue LTV. Discount that spend by the margin rate and you have margin LTV, the customer's actual capacity to fund acquisition. Ad invoices get settled out of margin, so margin LTV is the version to put beside CAC.
The gap is not academic. Take the LTV Calculator defaults: $80 AOV, 2.4 orders per year, a 2-year window, 55% margin. The same customer reads as $384 of revenue LTV but only $211.20 of margin LTV. Put a $70 CAC under each: the revenue version shows 5.5:1 and argues for heavier spend. The margin version shows 3.0:1 and remembers that the $70 left your account on day one and the $211.20 trickles in across 24 months.
CAC has its own split: paid versus blended. Paid CAC divides platform invoices by new customers; blended folds in everything else acquisition consumes, from agency retainers and creator deals to tooling and salaries. The CAC Calculator defaults show the stakes: $45,000 of media across 950 new customers is a $47.37 paid CAC. Once $12,000 of non-media acquisition spend joins the numerator, blended lands at $60.00, 27% higher. Allowable costs belong on the blended figure, because blended is the version your accounting eventually reports.
Watch the denominator too: first-time customers only. Spread the example's $57,000 across all 1,400 orders, repeat buyers included, and CAC appears to fall to $40.71. That 32% improvement is accounting fiction; the repeat buyers in the count cost nothing new to win.
Payback: the cash clock
Payback puts a clock on CAC. Divide acquisition cost by the margin a customer generates each month and you get the month in which that customer finishes repaying what they cost. Until then, the growth is financed out of your own cash; from then on, the customer is pure contribution.
CAC payback (months) = CAC ÷ monthly margin per customer
Run the CAC Payback Calculator defaults: a $60 CAC, $80 AOV, 55% margin rate, 0.2 orders per month. Each order carries $44 of margin, each customer produces $8.80 a month, and the $60 is repaid in 6.8 months. The lever hiding in that math is frequency. Halve it to 0.1 orders per month and repayment takes 13.6 months; lift it to 0.3 and it takes 4.5. Neither the product nor the CAC moved, yet the time the cash spends locked up swung by 3x.
This is why payback governs cash while the ratio governs strategy. The LTV:CAC Ratio Calculator defaults put $210 of lifetime margin against a $60 CAC: a 3.5 ratio, squarely in the healthy 3:1 to 5:1 band. What the ratio cannot see is timing. Fund a 1,000-customer month at that $60 CAC and $60,000 goes out immediately. The first month's margin at $8.80 per customer brings back only $8,800. Recovering the remaining $51,200 depends on those customers actually reordering. That is how a business with a 4:1 ratio still hits a cash wall.
For DTC, treat a payback under 6 months as strong, and 6 to 12 as survivable when capital can bridge the wait. Anything past 12 is a position that demands a specific justification.
The order to fix things in
When the stack fails, fix it upstream first. Everything downstream inherits the fix.
Margin before spend. When break-even ROAS computes out above roughly 3, the underlying problem is a thin margin, and no amount of media skill compensates for long. The upstream levers are price, landed cost, and order value; pulling break-even down from 3.3 to 2.4 changes what the account can do more than any audience or bidding tweak. Of the three, price is usually the quickest. Put $5 on the worked order's price and roughly $4.85 of it survives processing fees as new margin, effective the day you change it.
AOV before budget. Bundles, multi-unit pricing, and post-purchase upsells make each checkout carry more margin without buying a single extra visitor. A bigger cart relaxes the CPA ceiling and the ROAS target in the same motion. Model the lift with the AOV Calculator before you touch budgets.
Then frequency, then CAC. The payback defaults showed the frequency payoff: going from 0.2 to 0.3 orders per month takes repayment from 6.8 months to 4.5. That gain is earned from customers whose acquisition is already paid for. After that comes CAC itself; at the same $8.80 of monthly margin, cutting CAC from $60 to $45 shortens payback to 5.1 months. Creative, offers, and landing pages carry that lever, and they reset the whole stack at once.
Where StefanBrain fits
The stack hands you the targets; hitting them is creative and conversion work. StefanBrain does the making: static and video ads, landing pages, and copy tests built to acquire customers under your break-even CPA. Everything launches to Meta, with results fed back into the next round.
Start on the conversion side. Point the CRO Funnel Tool at a URL and it comes back with the page's conversion leaks ranked by impact, screenshots included. One edit to a leaking page then compounds across all the traffic your ads are already sending it. Be precise about what conversion rate moves, though: the break-even target itself never budges, because only AOV and margin sit in that formula. What improves is your side of the ledger. More orders from the same spend means a lower CAC and a higher achieved ROAS. That widens the gap between what you need and what you get across the whole stack.


